(and Hiring Industry Experienced Illustrators to Create them!)

Tale as Old as Time
Infographics are nothing new. Want to know why they work and how you can create them?
Illustrating information and data points visually isn’t an advent of the tech boom or vector graphics, but rather a centuries old method of leveraging the brain’s innate programming that prioritizes visuals.
President Abraham Lincoln relied on a map of the southern states, which was shaded to represent the density of enslaved black Americans in counties across the nation to help guide his political and military strategy.
He was, in essence, using this map to understand the story of his southern countrymen & adversaries.

Spinning a Yarn
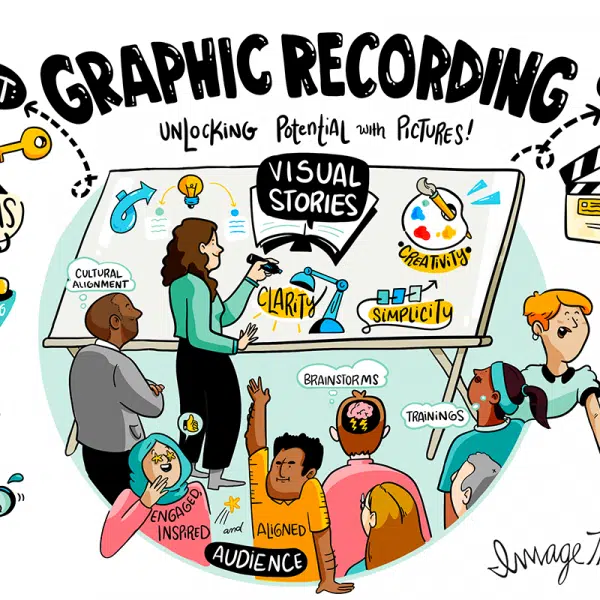
This ability of images to convey narrative is the cornerstone of graphic recording’s effectiveness. Like comic strips, film and TV, or illustrated children’s books, infographics enrich and add memorability to information by triggering emotional responses, ranging from curiosity to shock to excitement.
Think of the best presentations, ads, or marketing emails you’ve read. Odds are there is a central story or narrative that is being told that brought you in, and helped you connect to the material, product, or service, beyond a simple price point or need.
So why does that work? It’s neuroscience! The human brain craves stories. When information is conveyed in a way that allows for exploration of our social and emotional lives, and therefore creates catharsis, we become more engaged.
Studies show that using words that describe smells, tastes, or textures activate different centers of the brain than text without those descriptors. When we encounter text that is designed to elicit specific feelings, the parts of our brain that are tied to those corresponding sensory inputs light up and activate, lending greater impact to the information being conveyed.

Can You Picture It?
So, you’ve carefully crafted your data into a compelling story. You can tell it beautifully and picture it clearly in your head. Can everyone else?
The same way you’d include a chart or graph if you were trying to quickly communicate a complicated dataset, your experience, insights, mission statement, or strategic plan can be absorbed more easily when told visually.
Illustrated images are personal, hand-crafted, and utilize metaphor and visual mnemonics to engage more of the brain than text alone. Additionally, they communicate ideas faster, which is critical as attention spans get shorter year over year.
How much more engaging? How much faster? Content that includes visuals gets 94% more views according to Hubspot findings, and is absorbed 60,000 times faster than text alone, according to 3M behavioral research.

Paint by Numbers
94% more views and 60,000x are some big numbers, but they make sense. After all, 65% of people are visual learners, and visual media can be deciphered in less than a 10th of a second.
To throw some perspective on that, the 2019 Porsche 918 Spyder takes 2.2 seconds to hit 60MPH. That’s the fastest acceleration you can buy, and your brain can still process and decipher 22 images, assuming you can keep your eyes open when your head snaps back against the headrest.
(By the way, how much better does that 10th of a second statistic land when contextualized behind the wheel of a sportscar? I bet you could even picture it…)

“But I Can’t Draw”
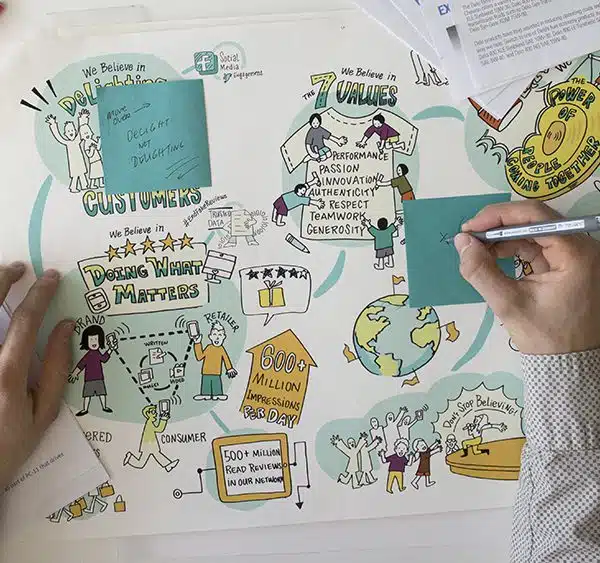
Fortunately, ImageThink’s team of graphic recorders has spent the last decade illustrating complex, industry specific concepts for Fortune 50 companies all over the world.
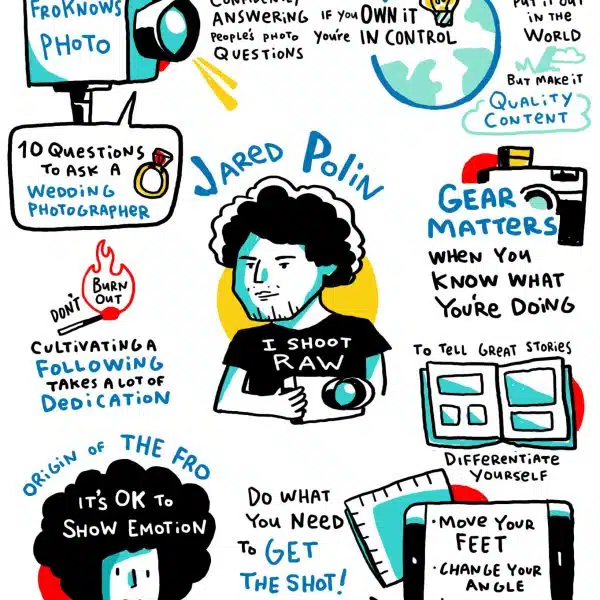
And while you may be more familiar with our work as graphic facilitators and visual note-takers, many of our clients can speak to the skill of our studio team at collaborating and co-creating visual assets for presentations, advertising and marketing campaigns, and in-office signage.
Our deep, cross-industry experience in a lot of board rooms, brainstorms, and big meetings means we know what ideas are most important for your business, and how to visually communicate them.
If you’re ready to start capturing the attention of the 50% of the human brain that is devoted to visual processing, don’t let your own rudimentary pencil skills get in your way. Moreover, avoid the ClipArt catastrophe and PowerPoint plainness by giving us a call today to talk through your message.
Ready to Picture Your Big Idea?
"*" indicates required fields