Fatigued and staring at a spreadsheet, paralyzed by options? You’re not alone.
Research shows that 65% of people are visual learners, and teams using visual collaboration tools reach consensus 30% faster (Lucidchart, 2023).
Visual decision-making tools cut through noise by:
- Simplifying complexity – Turning abstract ideas into clear frameworks.
- Enhancing collaboration – Aligning teams with a shared “picture” of the problem.
- Reducing bias – Surfacing assumptions and gaps in logic.
Let’s explore 3 visual tools, beyond your SWOT chart to help you make smarter decisions—no design skills needed.
1. Flowcharts: Map Out Every Possible Outcome
Best for: Process-heavy decisions (e.g., hiring, product launches).
A flowchart turns “What if?” scenarios into a step-by-step visual path.
Example:
- Problem: Changing our delivery methods
- Solution: Draw a flowchart to uncover unanticipated complexity, unearth areas of collaboration, and allow all stakeholders input
Example: A simple “yes/no” flowchart for business decisions.
2. Decision Trees: Weigh Risks & Rewards Visually
Best for: High-stakes choices (e.g., investments, pivots).
Decision trees assign probabilities and outcomes to each option so you can view your options and opportunity costs at-a-glance!
Check out this case study: Amazon uses decision trees to evaluate new features before development (Harvard Business Review).
ImageThink Tip: We have all heard of a pro-con list. When our Founder, Nora authored Draw Your Big Idea, she was sure to include a different type of visual assessment; the Pro- Pro List.
Rather than balancing “positives” against “negatives,” the Pro-Pro List challenges you to explore multiple advantages across different options. Instead of evaluating whether to move forward or not, you’re assessing what could be gained from either path.

3. Mind Maps: Brainstorm Without Limits
Best for: Creative or exploratory decisions (e.g., branding, strategy).
Mind maps radiate ideas from a central topic, revealing unexpected connections.
Try this:
- Write the core question in the center (e.g., “Increase Website Traffic”).
- Branch out with causes, solutions, and stakeholders.
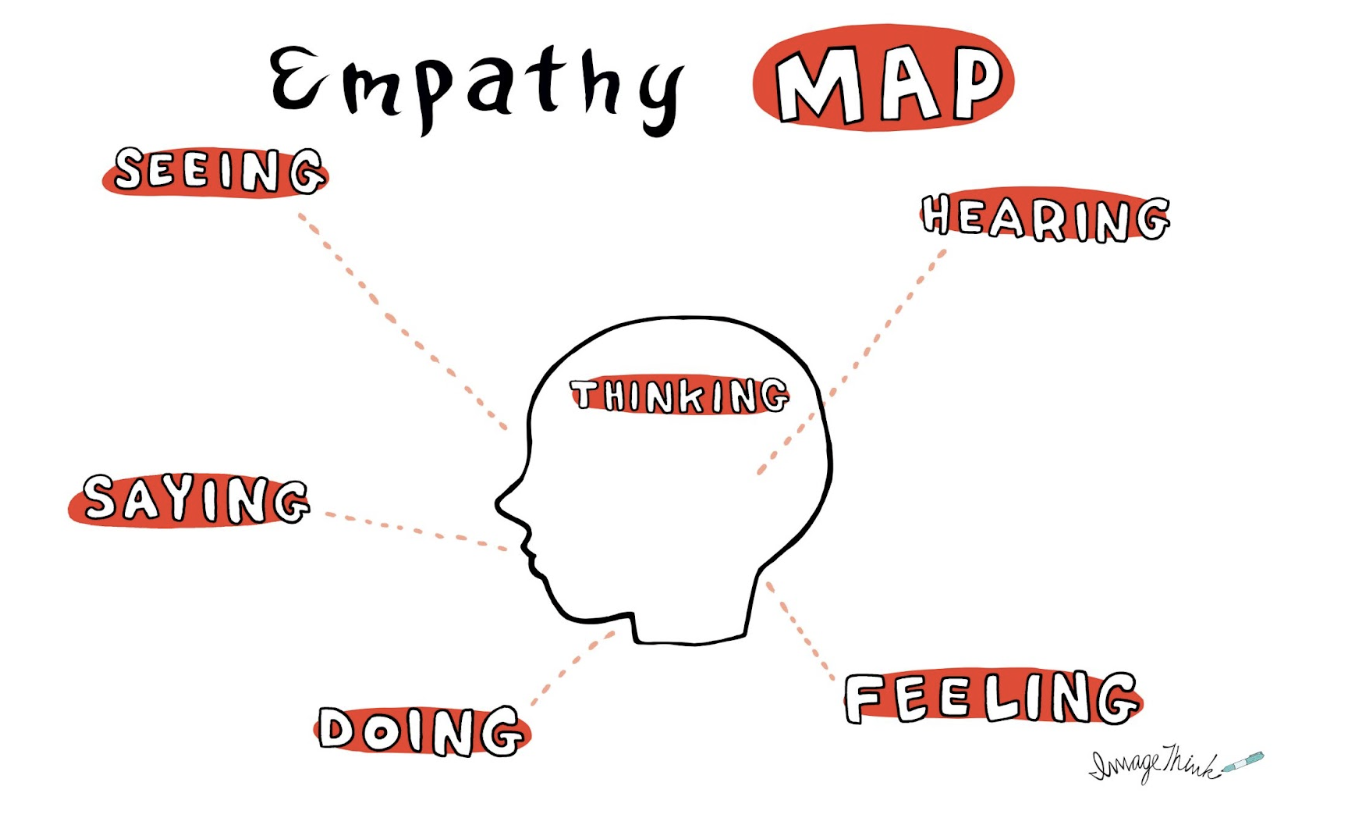
ImageThink Tip – Empathy Maps, are essentially Mind Maps centered around your end user or customer. Borrow the one provided to integrate an element of design thinking int your practice.
How to Get Started Today
- Pick one tool: Start simple—pick any of the above tools!).
- Use your hands first: Grab sticky notes or a whiteboard, no software or fancy tools needed.
- Refine digitally: You can use online software to map out ( i.e Canva or Figma), or use services like ImageThink who digitize all visuals created during meetings for you to keep and disseminate!
Key Takeaway
Visuals don’t just display decisions—they shape better ones. By externalizing your thinking, you’ll spot gaps, align teams, and act with confidence.
Need help visualizing a complex decision? Book a Visual Strategy Session with ImageThink.