Your team just spent two hours in a meeting about your customer onboarding process. Everyone talked in circles. Three people gave completely different descriptions of how it works. Someone said “I thought we fixed that bottleneck last quarter.” Nobody left with clarity.
Sound familiar?
This happens because most teams try to discuss complex processes using only words. You’re essentially asking people to build the same mental picture from verbal descriptions. It doesn’t work.
Visual process mapping changes this. Put the process on a wall where everyone can see it. Suddenly you’re all looking at the same thing. Gaps become obvious. Bottlenecks reveal themselves. Decisions happen faster.
What Is Visual Process Mapping?
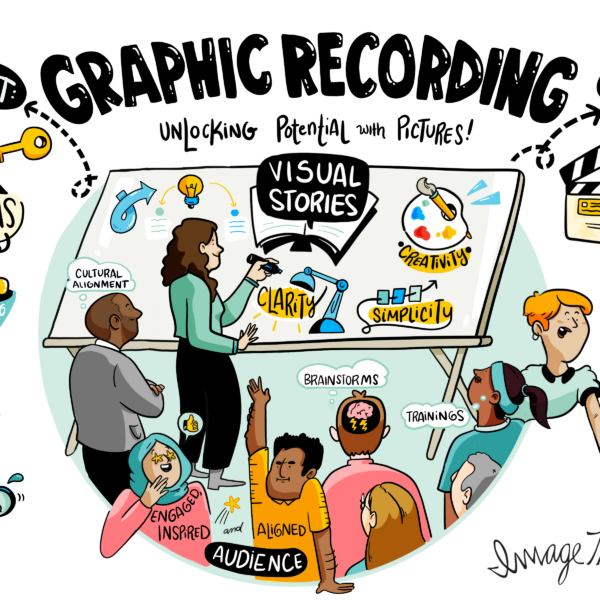
Visual process mapping turns workflows into diagrams everyone can see and understand. Instead of talking about your process, you draw it. Steps, decisions, handoffs, delays—all visible in one place.
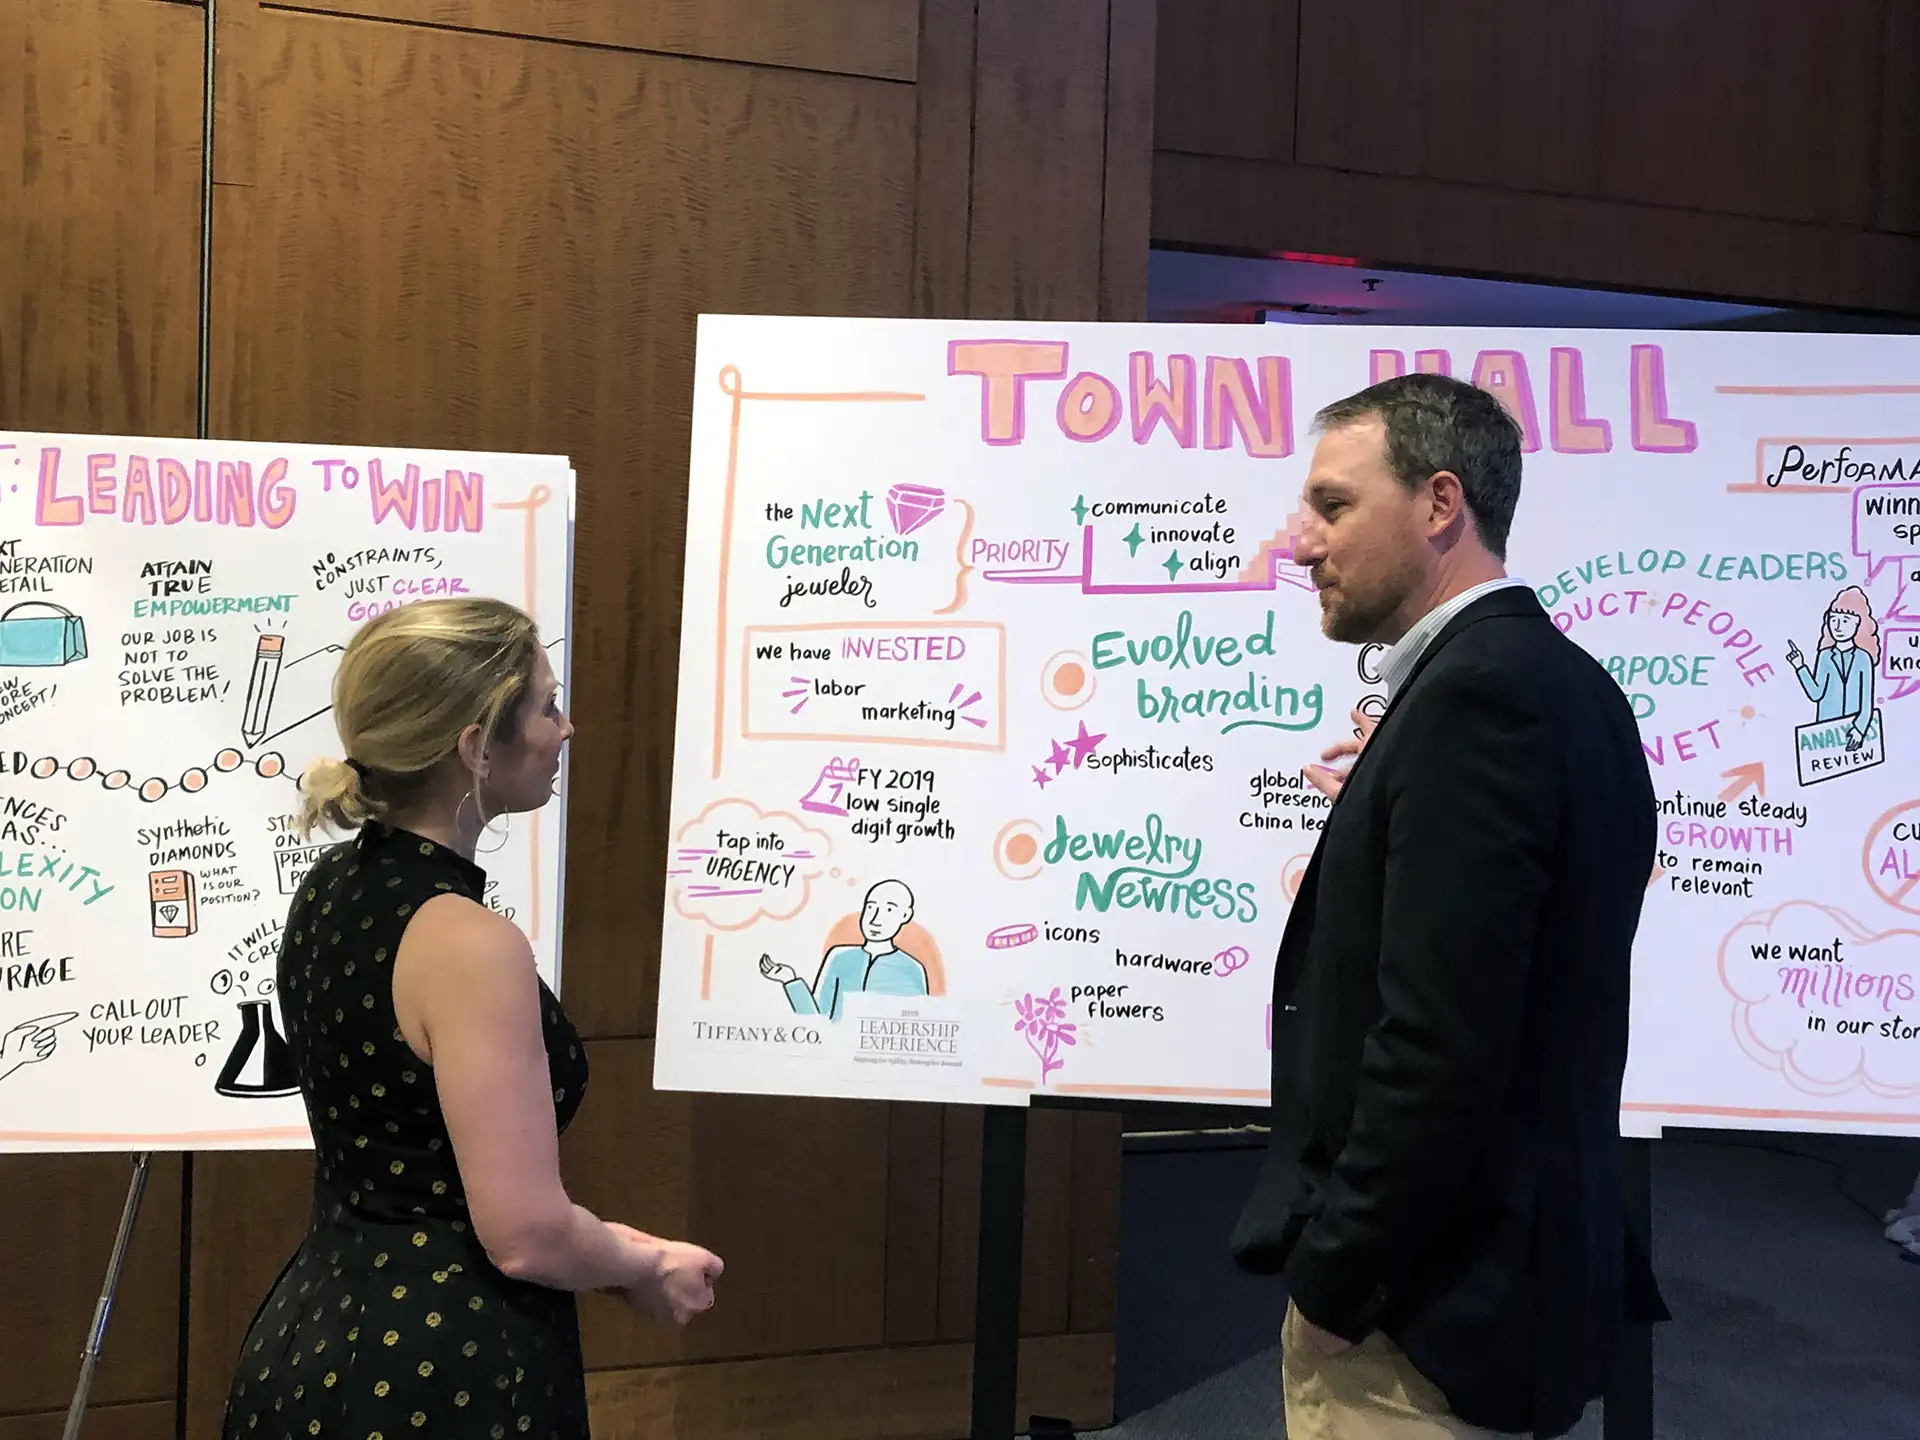
At ImageThink, we’ve been pioneering visual facilitation since 2009. We’ve mapped processes for Fortune 500 companies in technology, healthcare, pharma, and education. Across thousands of client sessions globally, we see the same transformation. Teams spend months discussing a process verbally. We map it visually in two hours. They finally understand what’s actually happening.
The method works because vision is your brain’s fastest processor. You can grasp a visual process map in seconds. Reading a written process document? That takes minutes or hours. And everyone interprets written descriptions differently.
Why Process Mapping Improves Meeting Efficiency
Everyone sees the same thing: No more “wait, I thought we did it this way” conversations. The process is right there. You’re discussing what you all see, not competing mental models.
Problems become obvious: That bottleneck you’ve been working around for months? It jumps out in a visual map. Redundant steps reveal themselves. Missing handoffs become clear.
Decisions happen faster: When you can point to the exact step causing problems, solutions emerge quickly. “We need to move this decision point earlier” beats twenty minutes of abstract discussion.
Teams stay focused: Verbal meetings drift. Visual maps keep you anchored. You’re working through the actual process, not getting sidetracked.
We facilitated a workflow mapping session for a global tech company launching a new platform. Their cross-functional team had met four times without alignment. Everyone had different ideas about the launch process.
We put it on the wall using visual process mapping. Within thirty minutes, they identified three critical handoffs missing from everyone’s mental model. Two hours later, they had a launch plan the entire team owned. Four meetings of confusion solved in one visual session.

Common Types of Visual Process Maps
Different processes need different visual approaches. Here’s what actually works in meetings.
Flowcharts: The classic. Great for showing decision points and different pathways through a process. Use these when your process has lots of “if this, then that” moments.
Swimlane diagrams: Show who does what. Each person or department gets a lane. You can see exactly where handoffs happen and where work sits waiting. Perfect for cross-functional processes.
Value stream maps: Show the full journey from start to finish. Include wait times, processing times, and where value actually gets added. Use these when you’re trying to eliminate waste.
SIPOC diagrams: Suppliers, Inputs, Process, Outputs, Customers. High-level view of what goes in and what comes out. Good for getting everyone on the same page before diving deep.
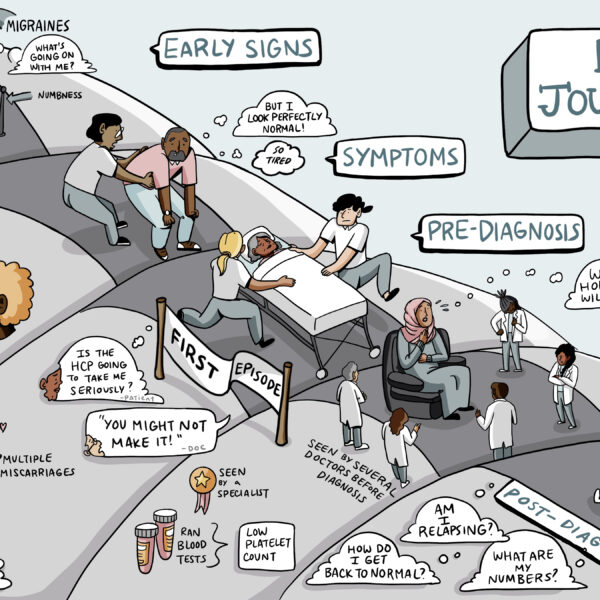
Journey maps: Show the experience from a customer or user perspective. Include emotions, pain points, and moments of truth. Essential when you’re designing customer-facing processes.
At ImageThink, we’re not rigid about which type to use. We’re full creative partners who understand facilitation and what each team needs. Sometimes a hybrid approach works best. The goal isn’t perfect methodology. It’s clarity that drives action.
Make Your Next High-Stakes Meeting Actually Count
How to Use Visual Process Mapping During Meetings
Start with the big picture: Before diving into details, map the high-level flow. What’s the starting point? What’s the end goal? What are the major phases? This gives everyone context.
Build it together: Don’t show up with a pre-made map. Create it live with your team. People catch errors. They add missing steps. They debate the right sequence. That collaborative process builds alignment faster than any presentation.
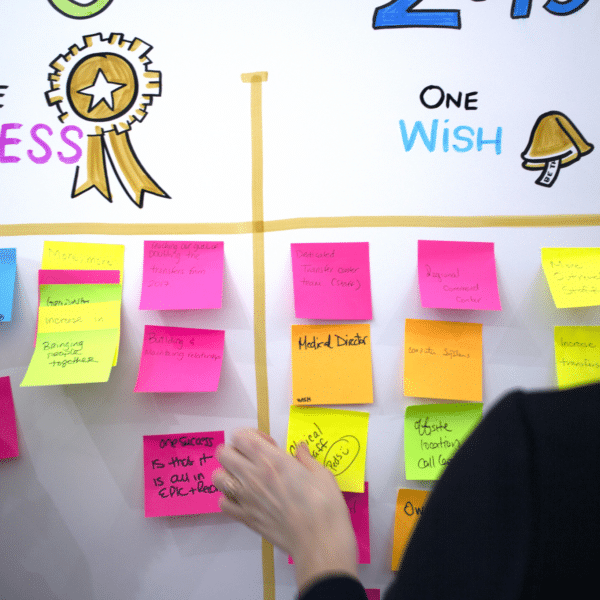
Use sticky notes first: Don’t commit to permanence too early. Sticky notes let you move steps around easily. You’ll rearrange things multiple times before the process makes sense.
Call out decision points clearly: Use diamonds or different colors. Decisions are where processes get complicated. Make them obvious.
Show wait times and handoffs: These are where most processes break down. Make them visible. You’ll immediately see where things get stuck.
Mark pain points as you go: When someone says “this step is always a nightmare,” mark it. Use a different color or a symbol. These become your priority fix list.
ImageThink’s visual facilitation team has refined these techniques across thousands of sessions globally. We’ve worked with world leaders and innovative thinkers who need to move fast. The key is balancing structure with flexibility. Too rigid and you miss insights. Too loose and you lose clarity.
Benefits of Visual Process Mapping for Teams
Faster onboarding: New team members understand the process in minutes instead of weeks. They can see what they need to do and how they fit in.
Better problem-solving: When the entire team sees the whole process, solutions come from unexpected places. Someone in step seven might solve a problem happening in step two.
Reduced meeting time: A healthcare system we worked with cut their process review meetings from three hours to ninety minutes. Same outcomes, half the time. The visual map eliminated repetitive explanations.
Stronger team alignment: Everyone literally on the same page. You’re looking at the same visual. Interpretation gaps disappear.
Clearer accountability: When you map who does what, ownership becomes obvious. No more “I thought you were handling that” moments.
Easier updates: Processes change. A visual map is easy to update. Change a sticky note. Redraw a line. Done. Written documentation? That’s a bigger project people avoid.
We supported a pharmaceutical company during a major compliance process redesign. Multiple departments, strict regulations, high stakes. The project had stalled for six months. Too much complexity, too many stakeholders, too much talking past each other.
We brought their core team together for visual process mapping. Over two days, we mapped their current state and designed their future state. The visual collaboration revealed redundancies they’d lived with for years. They cut their compliance review time by 40%.
Tools and Methods for Creating Visual Process Maps
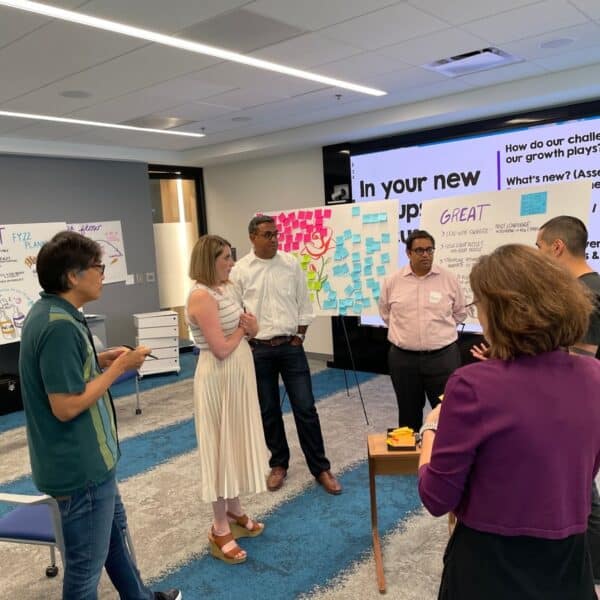
Low-tech solutions: Whiteboards, markers, and sticky notes remain our most powerful tools. Everyone can participate. No learning curve. No technical barriers.
At ImageThink, our graphic recorders and visual facilitators work on large-format walls. We create maps that teams can stand around, point at, and literally step into. This physical presence matters for meeting productivity.
Digital collaboration tools: Useful for remote teams or when you need to share widely. Look for tools that let multiple people edit simultaneously. Real-time collaboration is essential.
Hybrid approaches: Start on a wall with your team present. Capture it digitally for distribution. Best of both worlds—the energy of in-person creation plus the convenience of digital access.
Pre-made templates: Good for getting started quickly. But don’t let the template constrain you. Your process is unique. The map should reflect that.
The best tool depends on your situation. In-person workshop? Go physical. Remote team? Go digital. But never sacrifice collaboration for perfect-looking diagrams. A messy map everyone helped create beats a beautiful map nobody owns.
Tips for Making Your Visual Maps Clear and Actionable
Use consistent symbols: Rectangles for steps, diamonds for decisions, arrows for flow. Pick a system and stick with it. Consistency reduces cognitive load.
Keep text minimal: Short phrases, not sentences. “Review application” not “The team lead reviews the application for completeness and accuracy.” The visual shows relationships. Labels just identify components.
Use color purposefully: Different departments? Different colors. Problem areas? One color. Critical path? Another color. Random colors just create noise.
Number the steps: Simple sequential numbering helps people follow complex flows. “What happens after step 7?” is easier than “what happens after we review the preliminary assessment?”
Leave white space: Cramped maps are hard to read. Give elements room to breathe. This isn’t about fitting everything on one page. It’s about clarity.
Make it visible: Process maps hidden in shared drives don’t help anyone. Print it large. Put it where people work. Reference it in meetings. A visible map stays relevant.
Update it regularly: Processes evolve. If your map doesn’t, people stop trusting it. Make updates easy and frequent.
We’ve created visual process maps with teams across four continents. As the original pioneers in graphic recording and visual thinking, we’ve learned that clarity beats complexity every time. The best maps are the ones teams actually use to make decisions.
Better Meetings Start with Better Visuals
Your next process discussion doesn’t have to go in circles. Visual process mapping gives everyone a shared reference point. It surfaces problems faster. It drives decisions quicker. It keeps teams aligned.
The difference between a productive meeting and a time-wasting one often comes down to this: can everyone see what you’re talking about?
When you map your process visually, the answer is yes. Problems become obvious. Solutions emerge naturally. People leave with clarity about what happens next.
At ImageThink, we’re not just capturing processes—we’re helping teams transform how they work together. Our global team brings deep expertise in graphic facilitation and change management. We understand that the real value isn’t in the diagram. It’s in the alignment, efficiency, and better decisions that follow.
We’ve supported thousands of client sessions across technology, healthcare, education, nonprofits, and pharma. We know what works. Visual process mapping isn’t about making pretty pictures. It’s about making your meetings actually accomplish something.
Ready to transform your process meetings? ImageThink’s visual facilitation experts help teams map complex workflows and achieve clarity fast. Since 2009, we’ve been pioneers in visual thinking and strategic facilitation. Whether it’s a critical launch, operational efficiency, or cross-functional alignment, we’re your creative partner in making work visible. Let’s talk about your next meeting.