A strong research project can still end in a weak outcome: a folder full of notes, quotes, and transcripts that never becomes a decision.
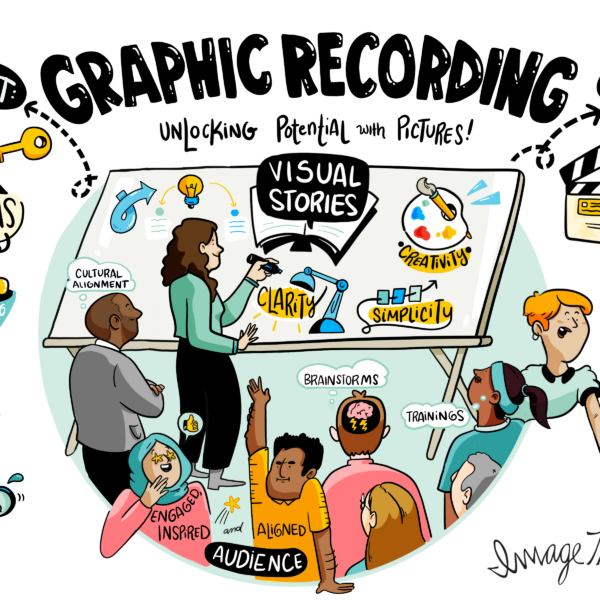
That’s the gap research synthesis is meant to close. It turns scattered inputs into a clear story—what’s happening, why it matters, and what a team should do next.
When you add visual research methods to the mix, synthesis becomes faster, more collaborative, and easier to communicate across stakeholders.
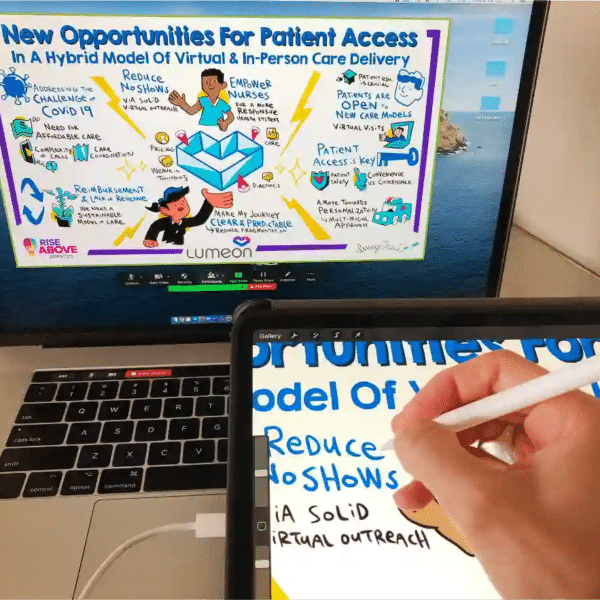
For teams that want to move quickly from evidence to alignment, ImageThink’s facilitation services bring visual facilitation into the room—capturing themes in real time, reflecting patterns back to the group, and helping stakeholders converge on what matters most.
What Is Research Synthesis?
Research synthesis is the process of combining qualitative data from multiple sources into themes, insights, and a narrative that supports decision-making.
It’s not the same as summarizing. Research synthesis asks: What patterns repeat? What tensions show up? What are people trying to achieve—and what’s getting in the way?
In practice, research synthesis often includes qualitative analysis steps like clustering, labeling, and prioritizing findings so the team can move from evidence to action.
The Problem with Traditional Research Synthesis
Traditional synthesis work often happens in documents: long slide decks, dense spreadsheets, or written summaries that only a few people read.
The result is predictable. Teams lose the thread, stakeholders debate isolated quotes, and the work turns into “interesting findings” instead of strategic direction.
When synthesis stays text-heavy, it also hides the logic of how conclusions were reached. That makes it harder to build trust in the qualitative analysis.
Why Visual Research Synthesis Works
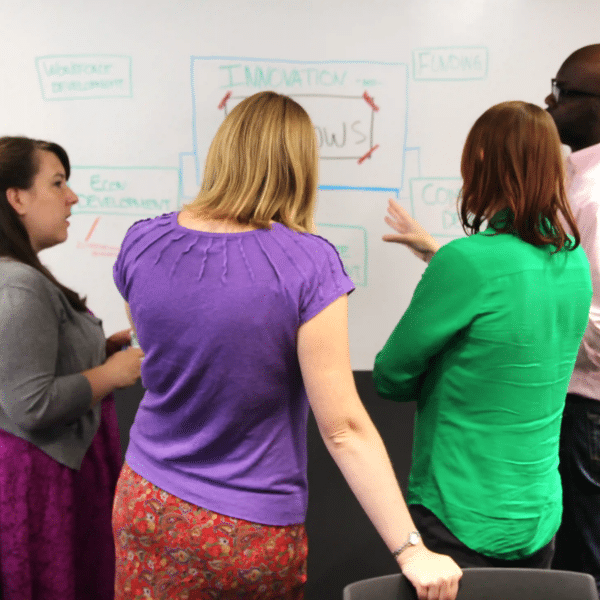
Visual research synthesis makes the thinking visible. Instead of burying patterns in paragraphs, it shows how inputs connect and how themes emerged.
It also speeds up sensemaking. When a team can see the data—grouped, named, and mapped—they can align faster and reduce circular debate.
Most importantly, visual research creates shared ownership. People don’t just receive the insights; they understand the path from raw input to conclusions.
Common Inputs That Need Synthesis
Research synthesis is especially valuable when you have lots of qualitative data and competing interpretations.
Common inputs include interview notes, open-ended survey responses, workshop outputs, customer support logs, stakeholder feedback, and field observations.
These inputs are rich, but without thematic analysis and structure, they stay fragmented and hard to use.
Visual Techniques for Research Synthesis
A few visual techniques show up again and again in effective research synthesis.
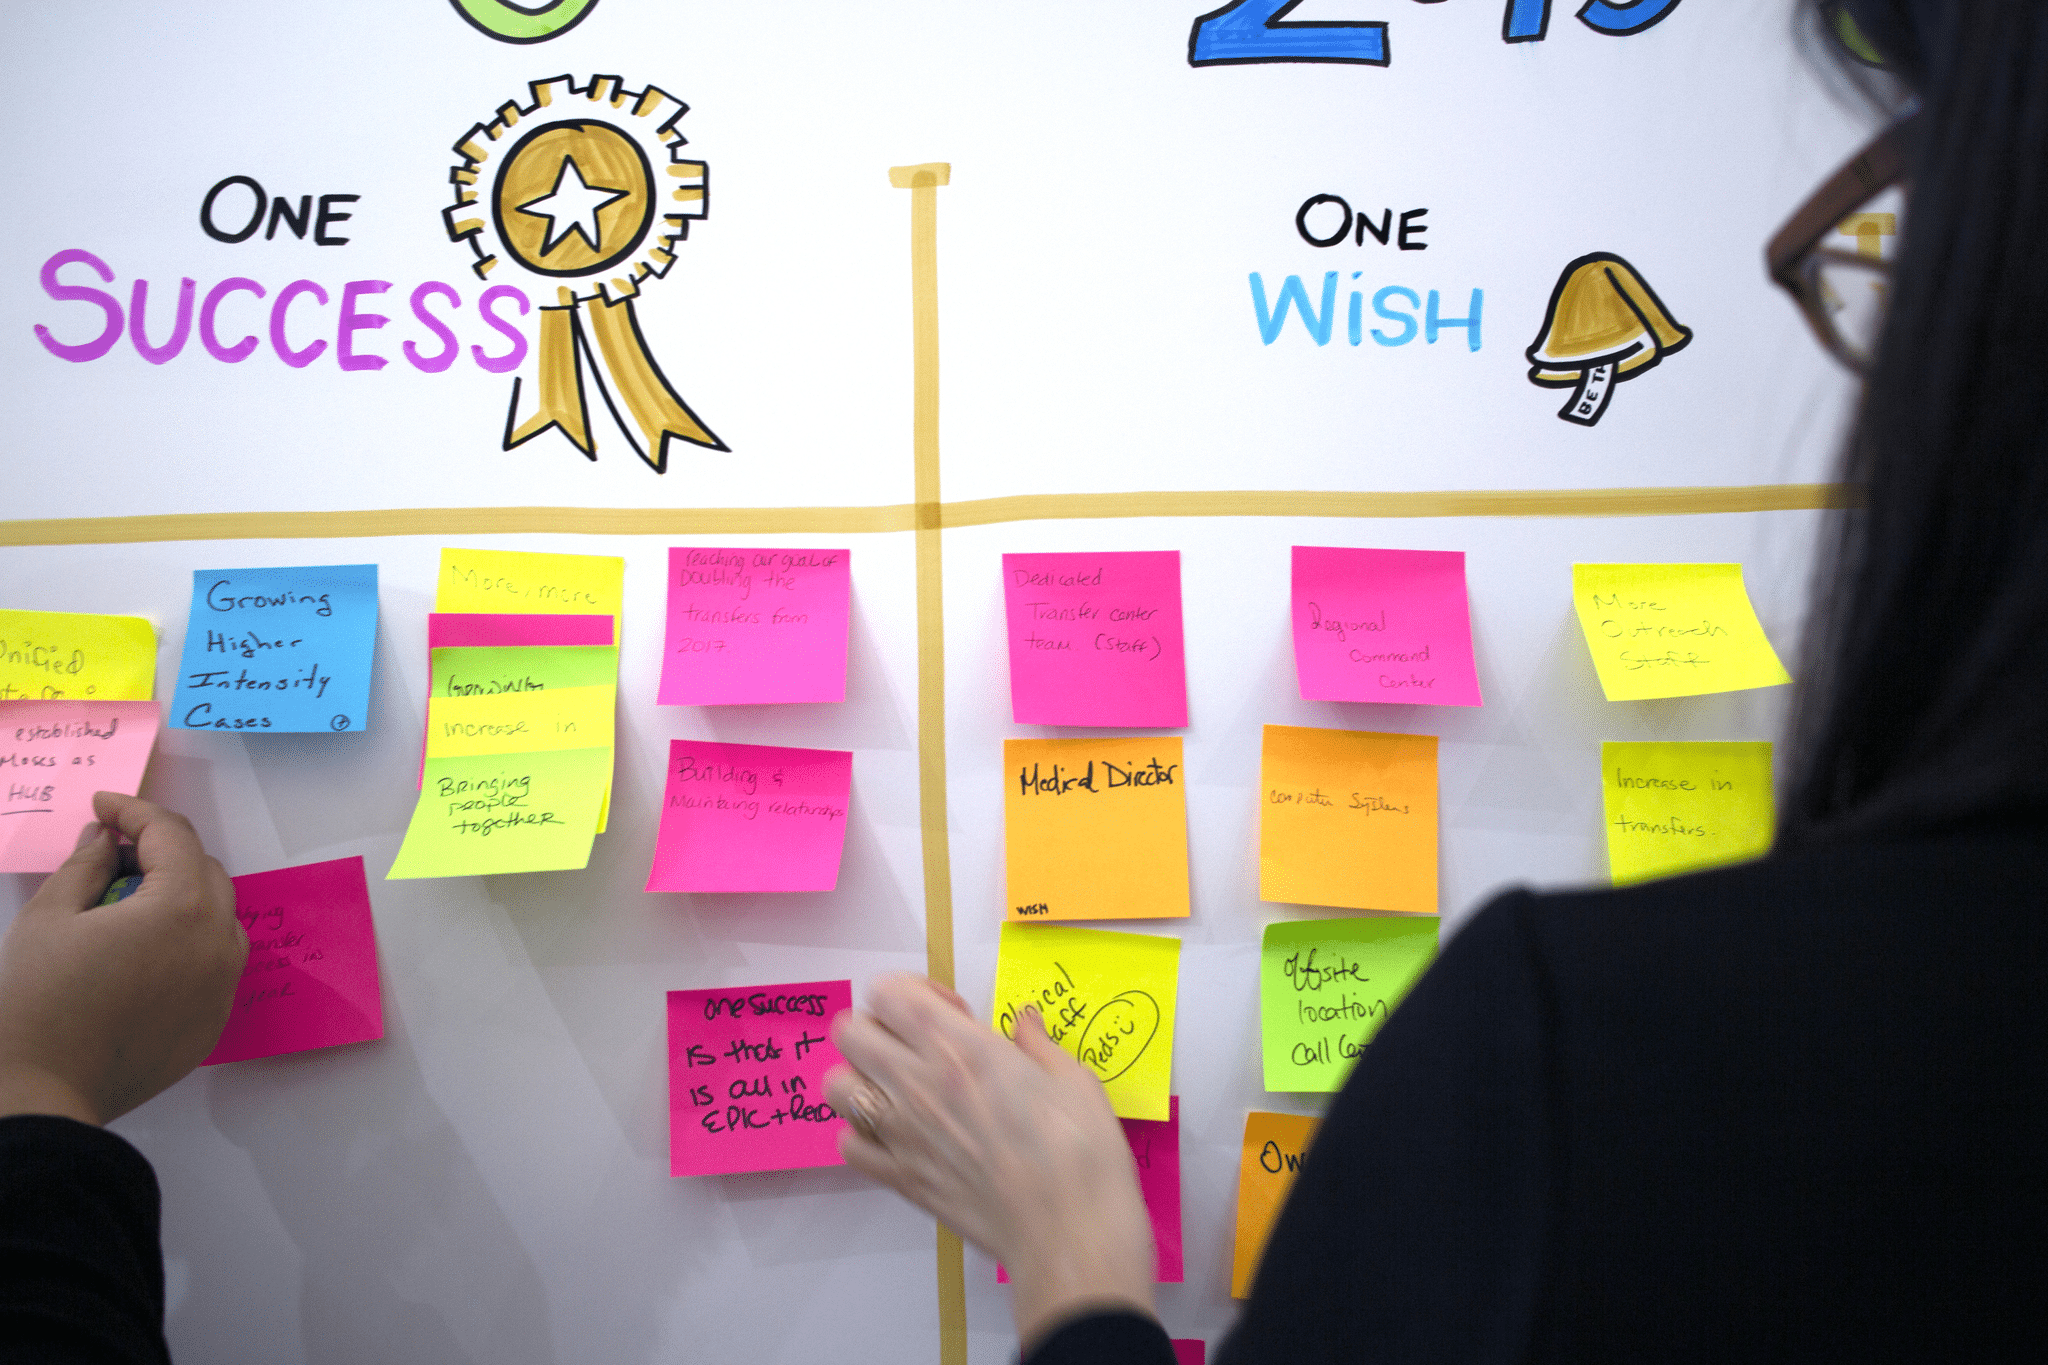
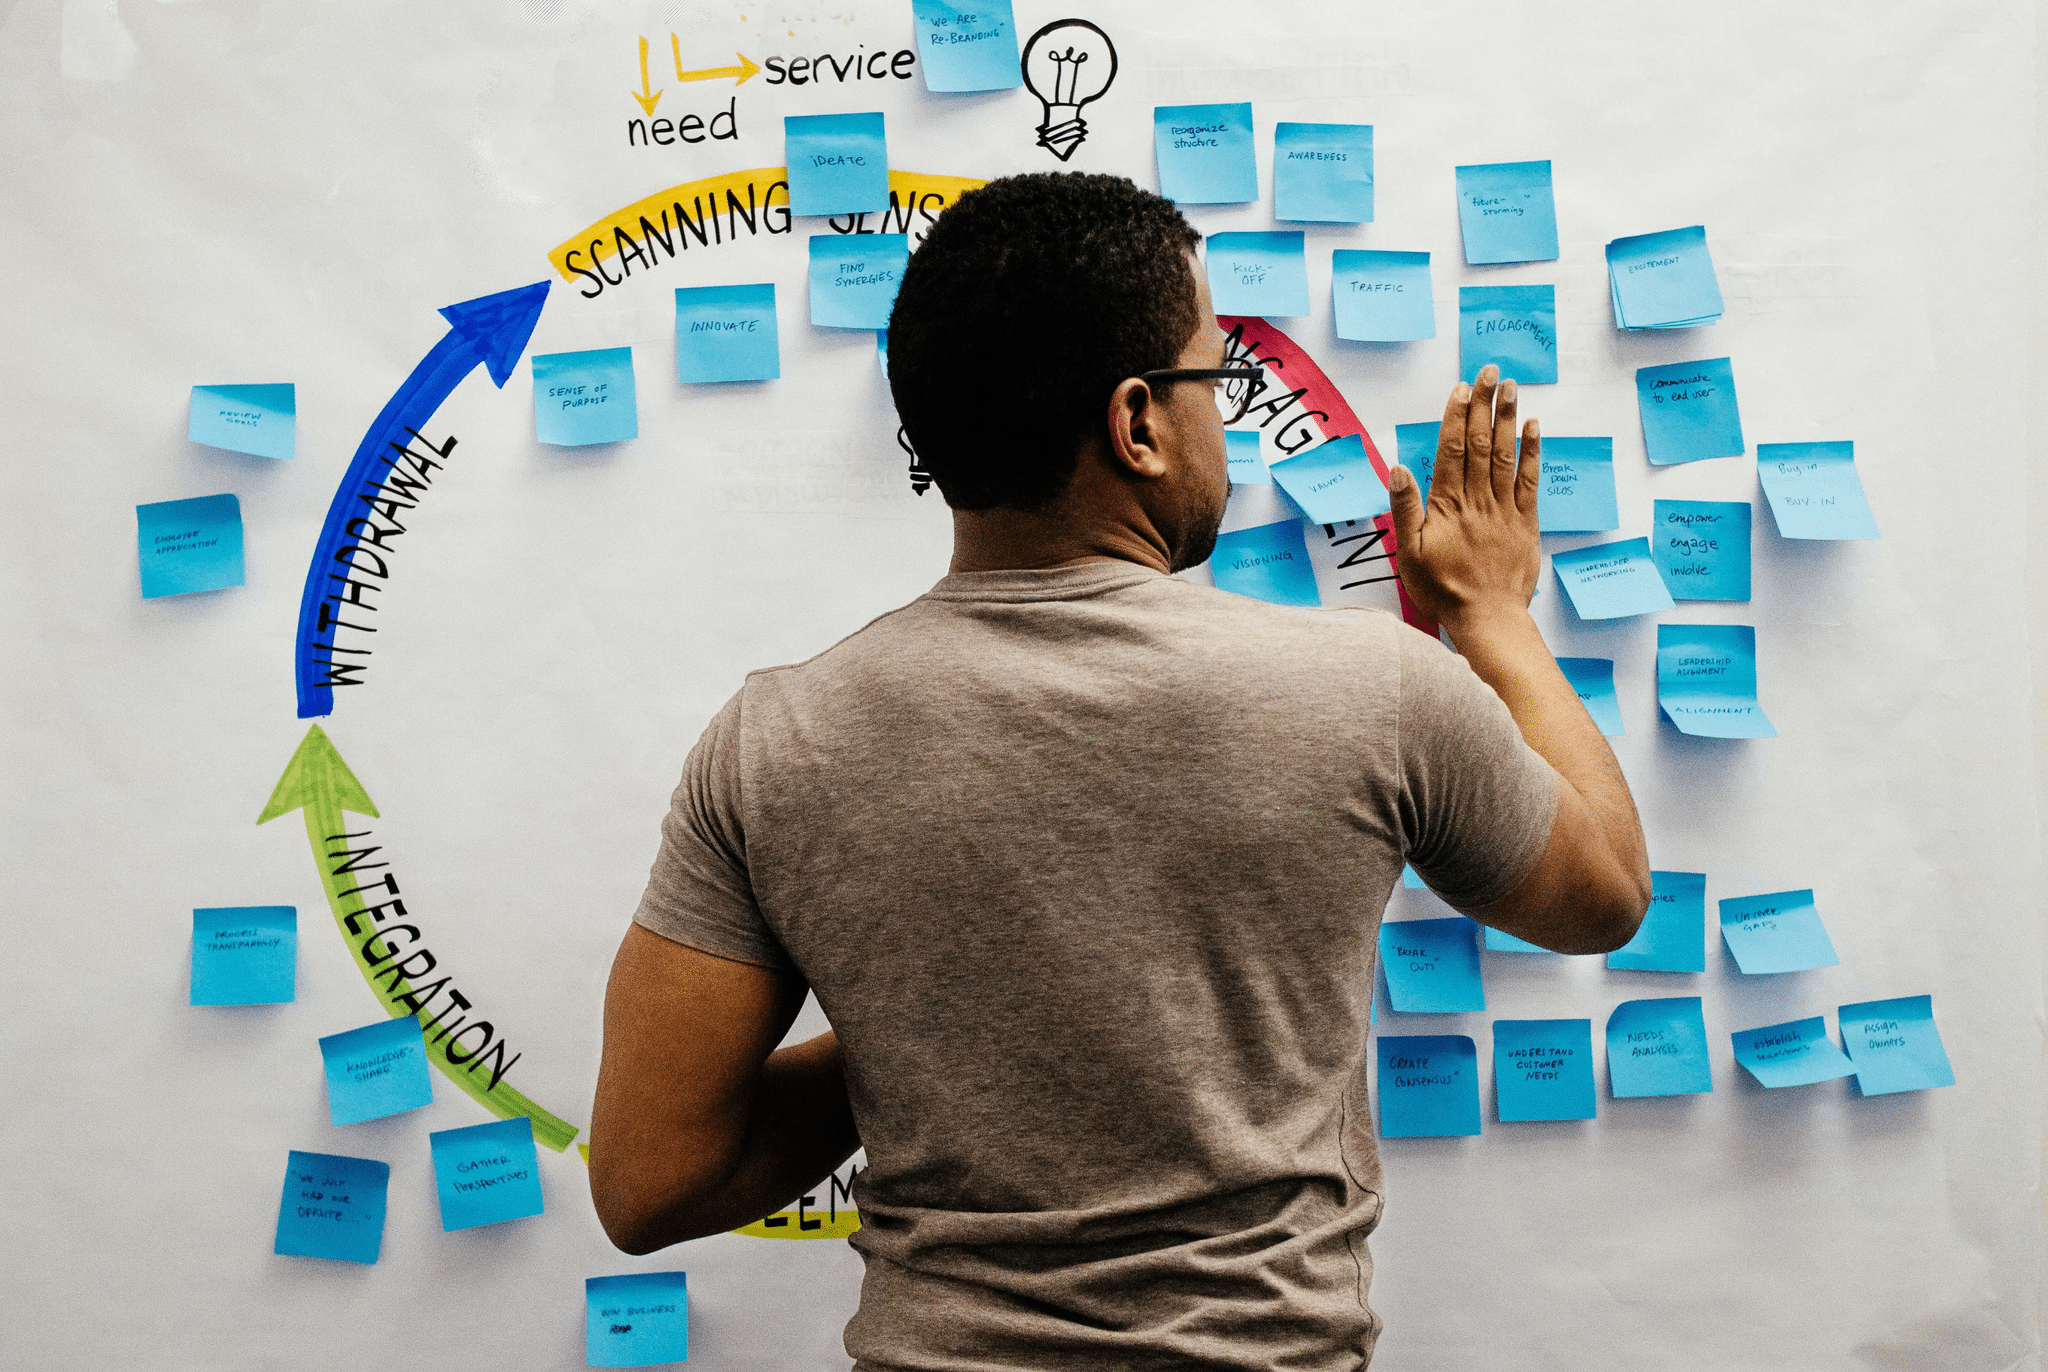
Affinity mapping groups observations into clusters, then into themes. It’s a classic bridge from raw notes to thematic analysis.
Insight mapping connects themes to drivers, barriers, and opportunities, so the team can see what’s causing what.
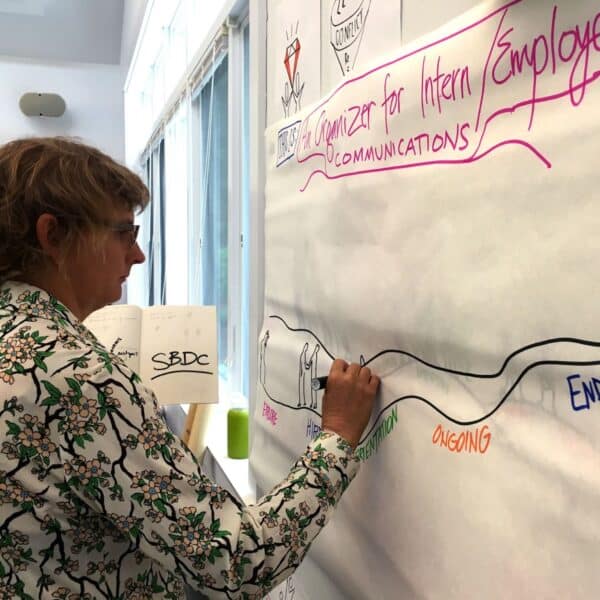
Journey or process mapping places findings along a timeline or workflow, which is especially useful for service design and patient or customer experience work.
From Chaos to Clarity: The Synthesis Process
A reliable visual synthesis process usually follows a few phases.
First, you gather and normalize inputs: clean up notes, create consistent labels, and make sure the qualitative analysis is grounded in evidence.
Next, you cluster and name themes. This is where thematic analysis becomes explicit: you’re deciding what belongs together and why.
Then you translate themes into insights. Insight mapping helps here by forcing clarity: what’s the insight, what’s the evidence, and what implication does it have?
Turn Your Research Into Clear, Actionable Insight
Making Research Findings Actionable
Research synthesis only creates value when it points to decisions.
A simple way to do that is to pair each insight with a “So what?” and a “Now what?”: what does this mean for strategy, and what should we test or change?
To keep momentum, end with a decision-ready output: 3–5 prioritized opportunities, the evidence behind each one, and a clear owner for next steps. A quick confidence check (high/medium/low) helps leaders see where the data is strong and where you need another round of interviews or testing.
This is also where visual research synthesis supports better decisions: it makes tradeoffs visible and helps teams prioritize what to address first.
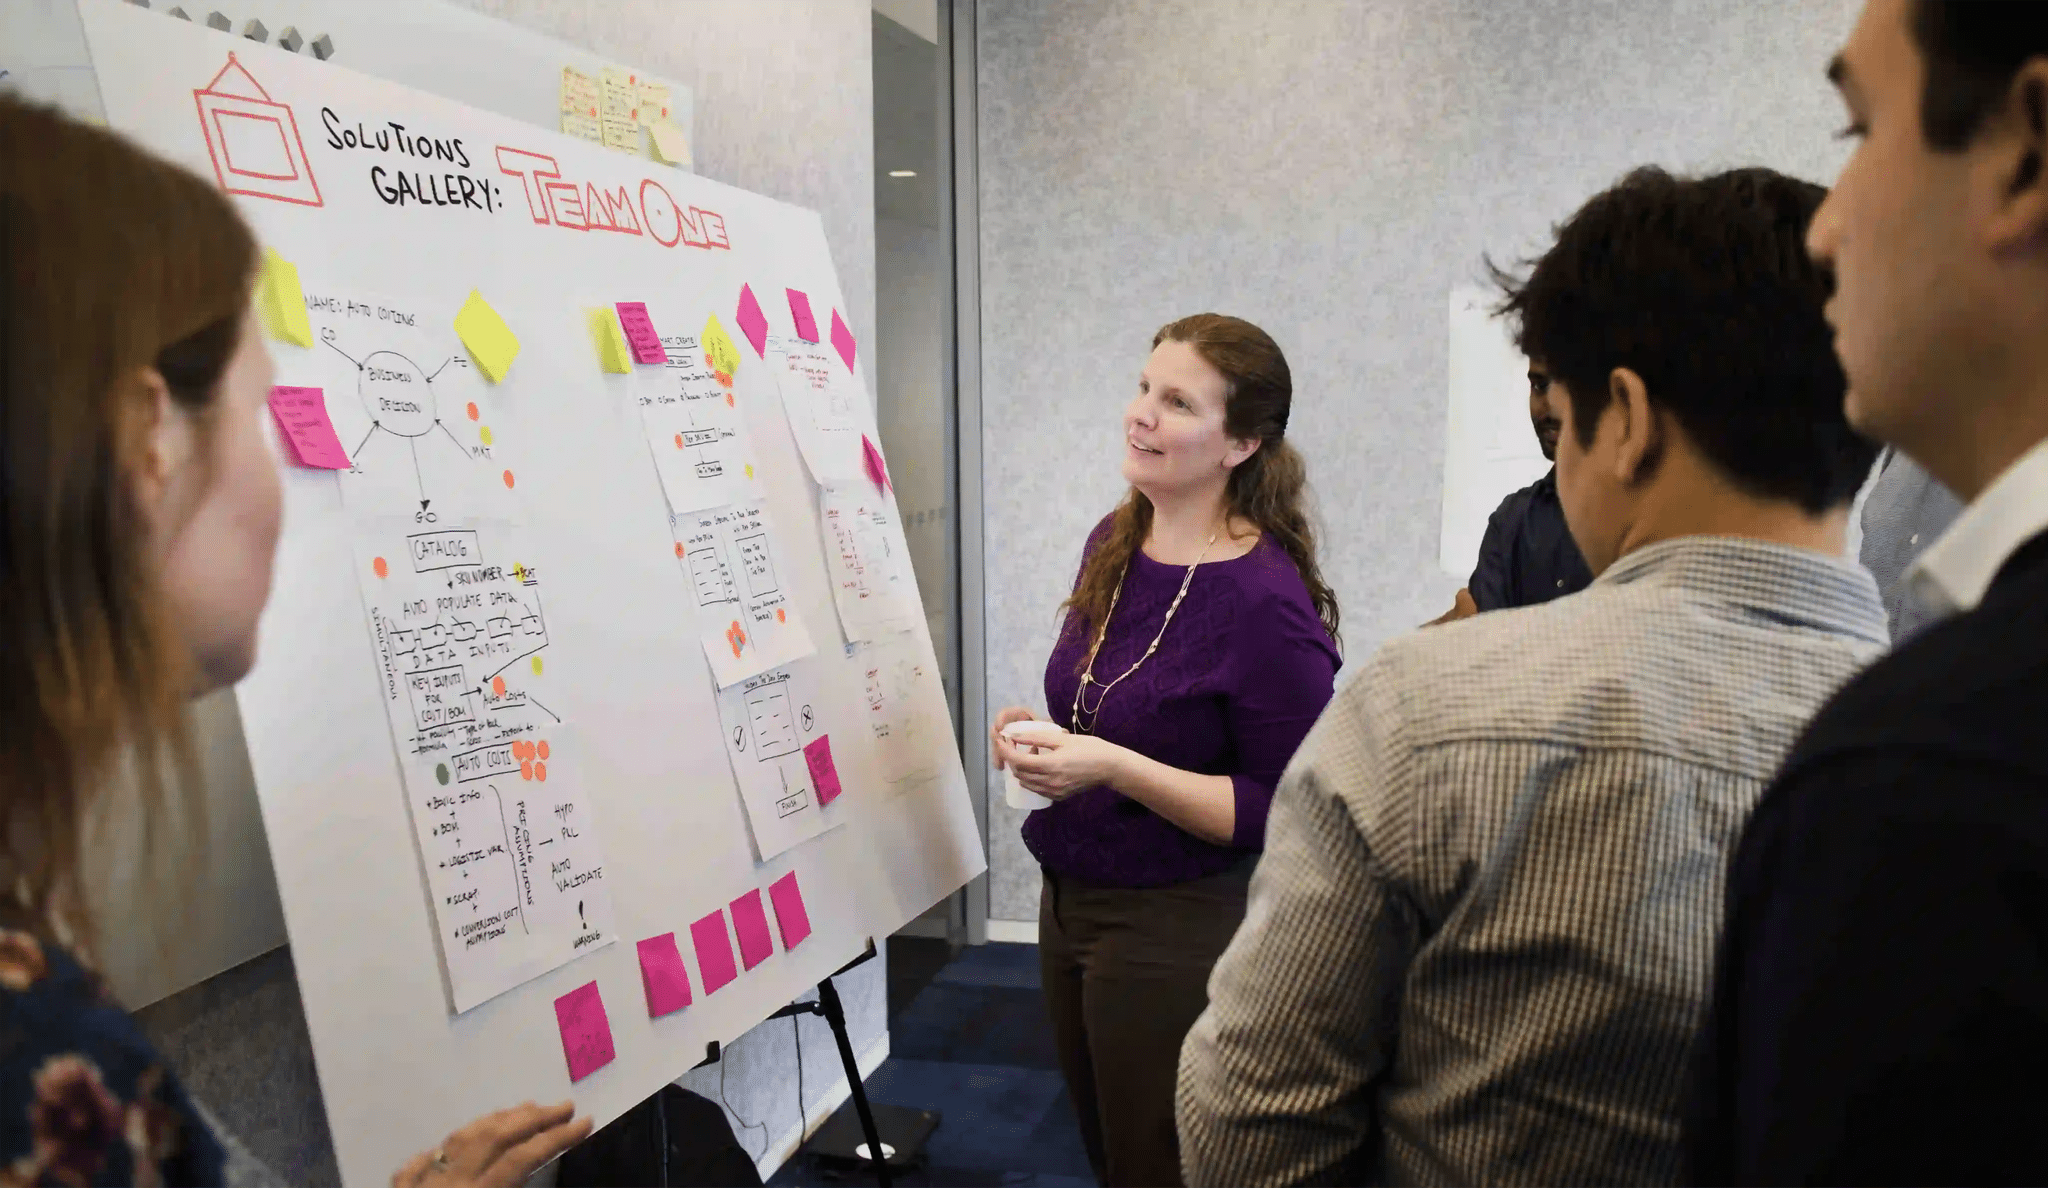
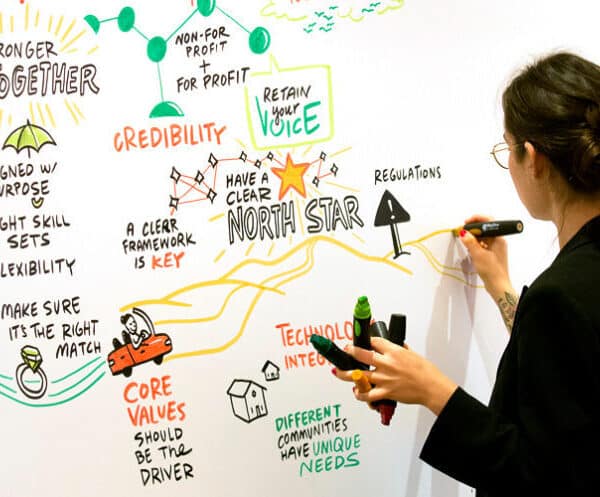
Visual Artifacts That Tell the Story
The output of research synthesis shouldn’t be a data dump. It should be a story people can retell.
Useful artifacts include a one-page executive summary, an insight map, a synthesized journey map, and a set of “headline insights” with supporting evidence.
Before/after examples can be especially persuasive: raw sticky notes on one side, a clean insight framework on the other.
Common Mistakes in Research Synthesis
One mistake is jumping to conclusions too early. If the team starts with a preferred answer, the qualitative analysis becomes confirmation bias.
Another is creating themes that are too broad to act on. A theme like “communication” isn’t helpful until you define what kind, where it breaks down, and what it affects.
Finally, teams often skip synthesis entirely and go straight to recommendations. Strong research synthesis earns the right to recommend by showing the logic from data to insight.
Great Research Only Matters When the Story Is Clear
Research synthesis turns qualitative data into clarity—and clarity into action.
With visual research methods, teams can move from sticky notes to a shared narrative, supported by thematic analysis and insight mapping that leaders can use.
When the story is clear, decisions get easier, alignment happens faster, and research actually changes what teams do next.