Picture this: a fast-moving strategy session, a room full of smart people—and everyone walking out with a different version of what just happened. Digital visualization exists to solve exactly that. Here’s what you need to know: the tools, the file types, and the illustration workflow from first brief to final delivery.
What Is Digital Visualization?
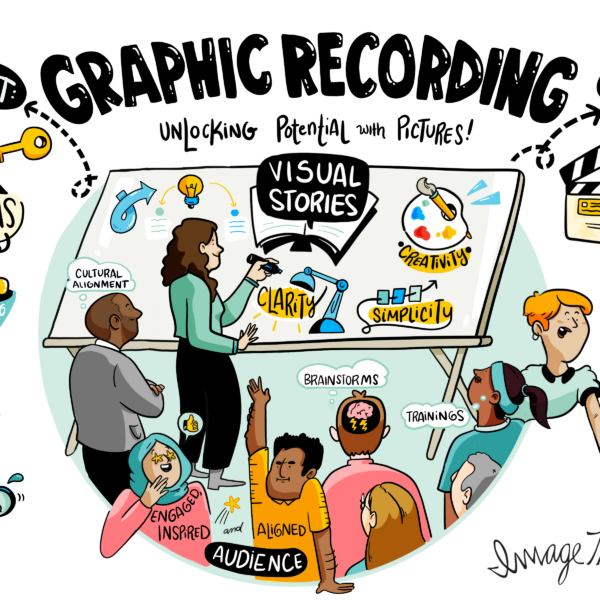
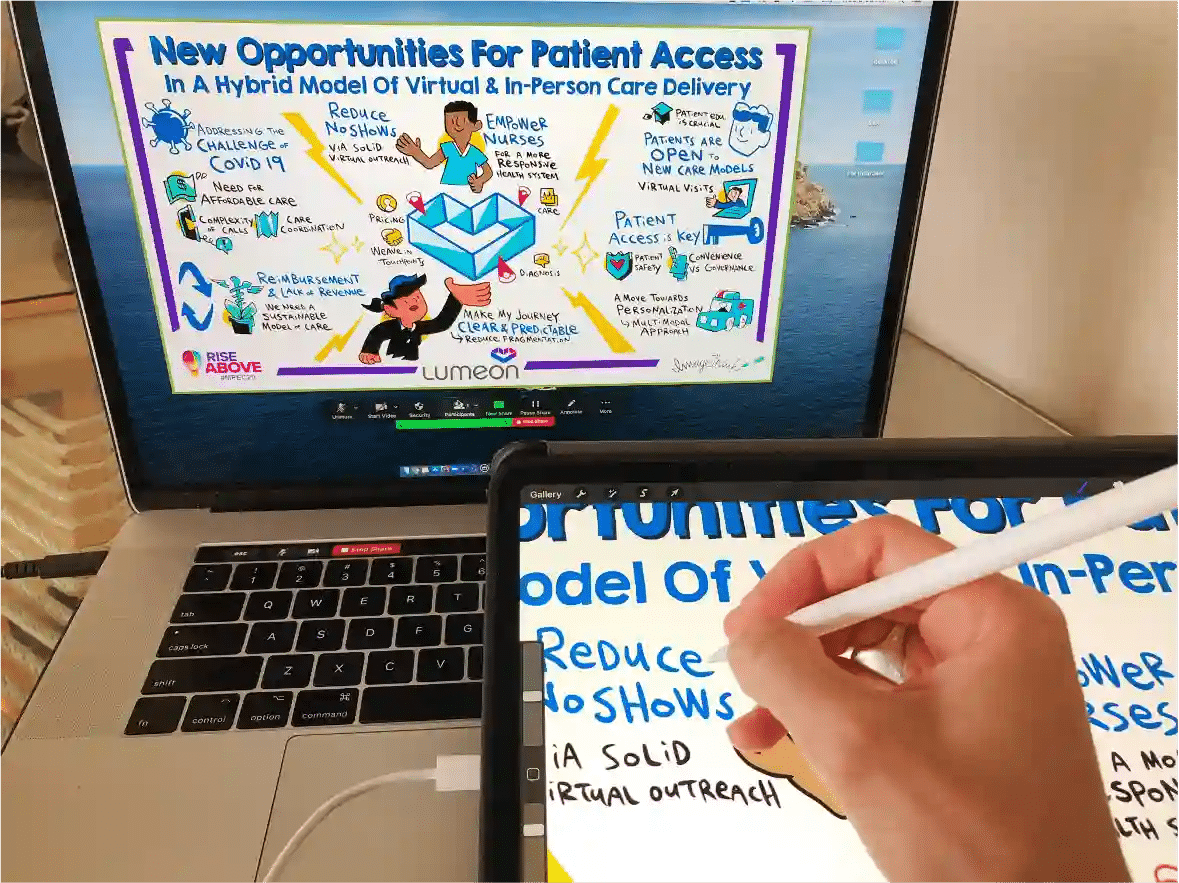
Digital visualization means using software and tablets to translate ideas, conversations, and data into clear visual communication on screen—whether that’s a live visual at a leadership offsite, a synthesized workshop summary, or a digital whiteboard helping a distributed team see the same picture. The goal: make the message impossible to miss.
Why Digital Visualization Matters in Modern Work
Many teams work remotely or in hybrid rooms where conversations move fast and people leave with different interpretations. Digital visualization creates a shared reference—when everyone sees the same visual, visual communication becomes clearer and visual facilitation becomes more effective. In our 17 years working with Fortune 50 companies across 15 countries, organizations that make their ideas visible make faster, better-aligned decisions.
Core Tools Used in Digital Visualization
Most digital visualization projects rely on three categories: a drawing app for live capture, a digital whiteboard for collaboration, and a design tool for polish. Start with one of each—add tools as your illustration workflow demands more control.
| Use Case | Drawing Tool | Collaboration | Polish / Delivery |
| Live event capture | Procreate (iPad) | Miro / FigJam | Deliver as-is |
| Workshop collaboration | Procreate / Photoshop | Miro / digital whiteboard | Keynote / PowerPoint |
| Polished deliverable | Procreate / Photoshop | — | Adobe Illustrator |
| Remote / virtual | Procreate via screen share | Miro / Figma | PDF or PNG export |
File Types Every Digital Visualization Project Uses
Choosing the wrong format at delivery is one of the most common mistakes in the field. The right file type depends on how the visual will be used.
| If you need to… | Use | Why |
| Share quickly | JPG | Small file, easy to send |
| Keep transparency / use in slides | PNG | Crisp with no background |
| Print or approve | Reliable across platforms | |
| Edit later | PSD / AI (layered) | Preserves layers for revisions |
| Scale infinitely | SVG / EPS / AI | Vector: no quality loss |
The core decision is vector vs. raster. Raster files (JPG, PNG) suit hand-drawn aesthetics and screen sharing. Vector files (SVG, AI) scale infinitely—right for logos, icons, and anything appearing across multiple sizes. Most teams use raster for main artwork and vector for brand elements.
Understanding Layers, Resolution, and Canvas Size
Three decisions shape everything before a line is drawn: layers (keep elements editable), resolution (300 PPI for print, 72–96 PPI for screen), and canvas size (start with the final use in mind). Clean layer management is what separates a quick sketch from a reusable professional asset.
A Typical Digital Visualization Workflow
A reliable process keeps projects smooth and eliminates last-minute surprises. Here’s the path ImageThink follows:
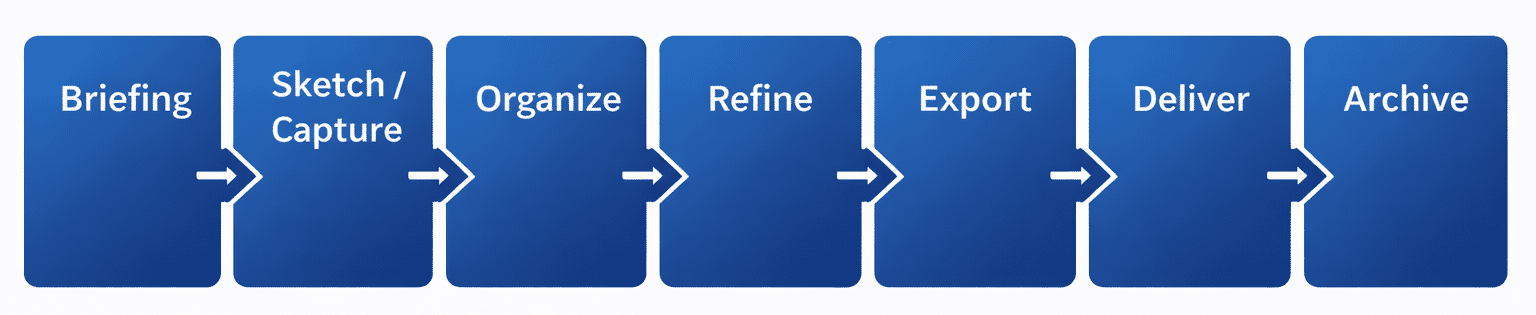
Step 1: Briefing and Goal Alignment
Clarify what the visual is for, who it’s for, and what decision it needs to support. Good briefing is where digital visualization becomes strategic—it determines canvas size, tone, file format, and scope before a single line is drawn.
Step 2: Live Capture or Concept Sketching
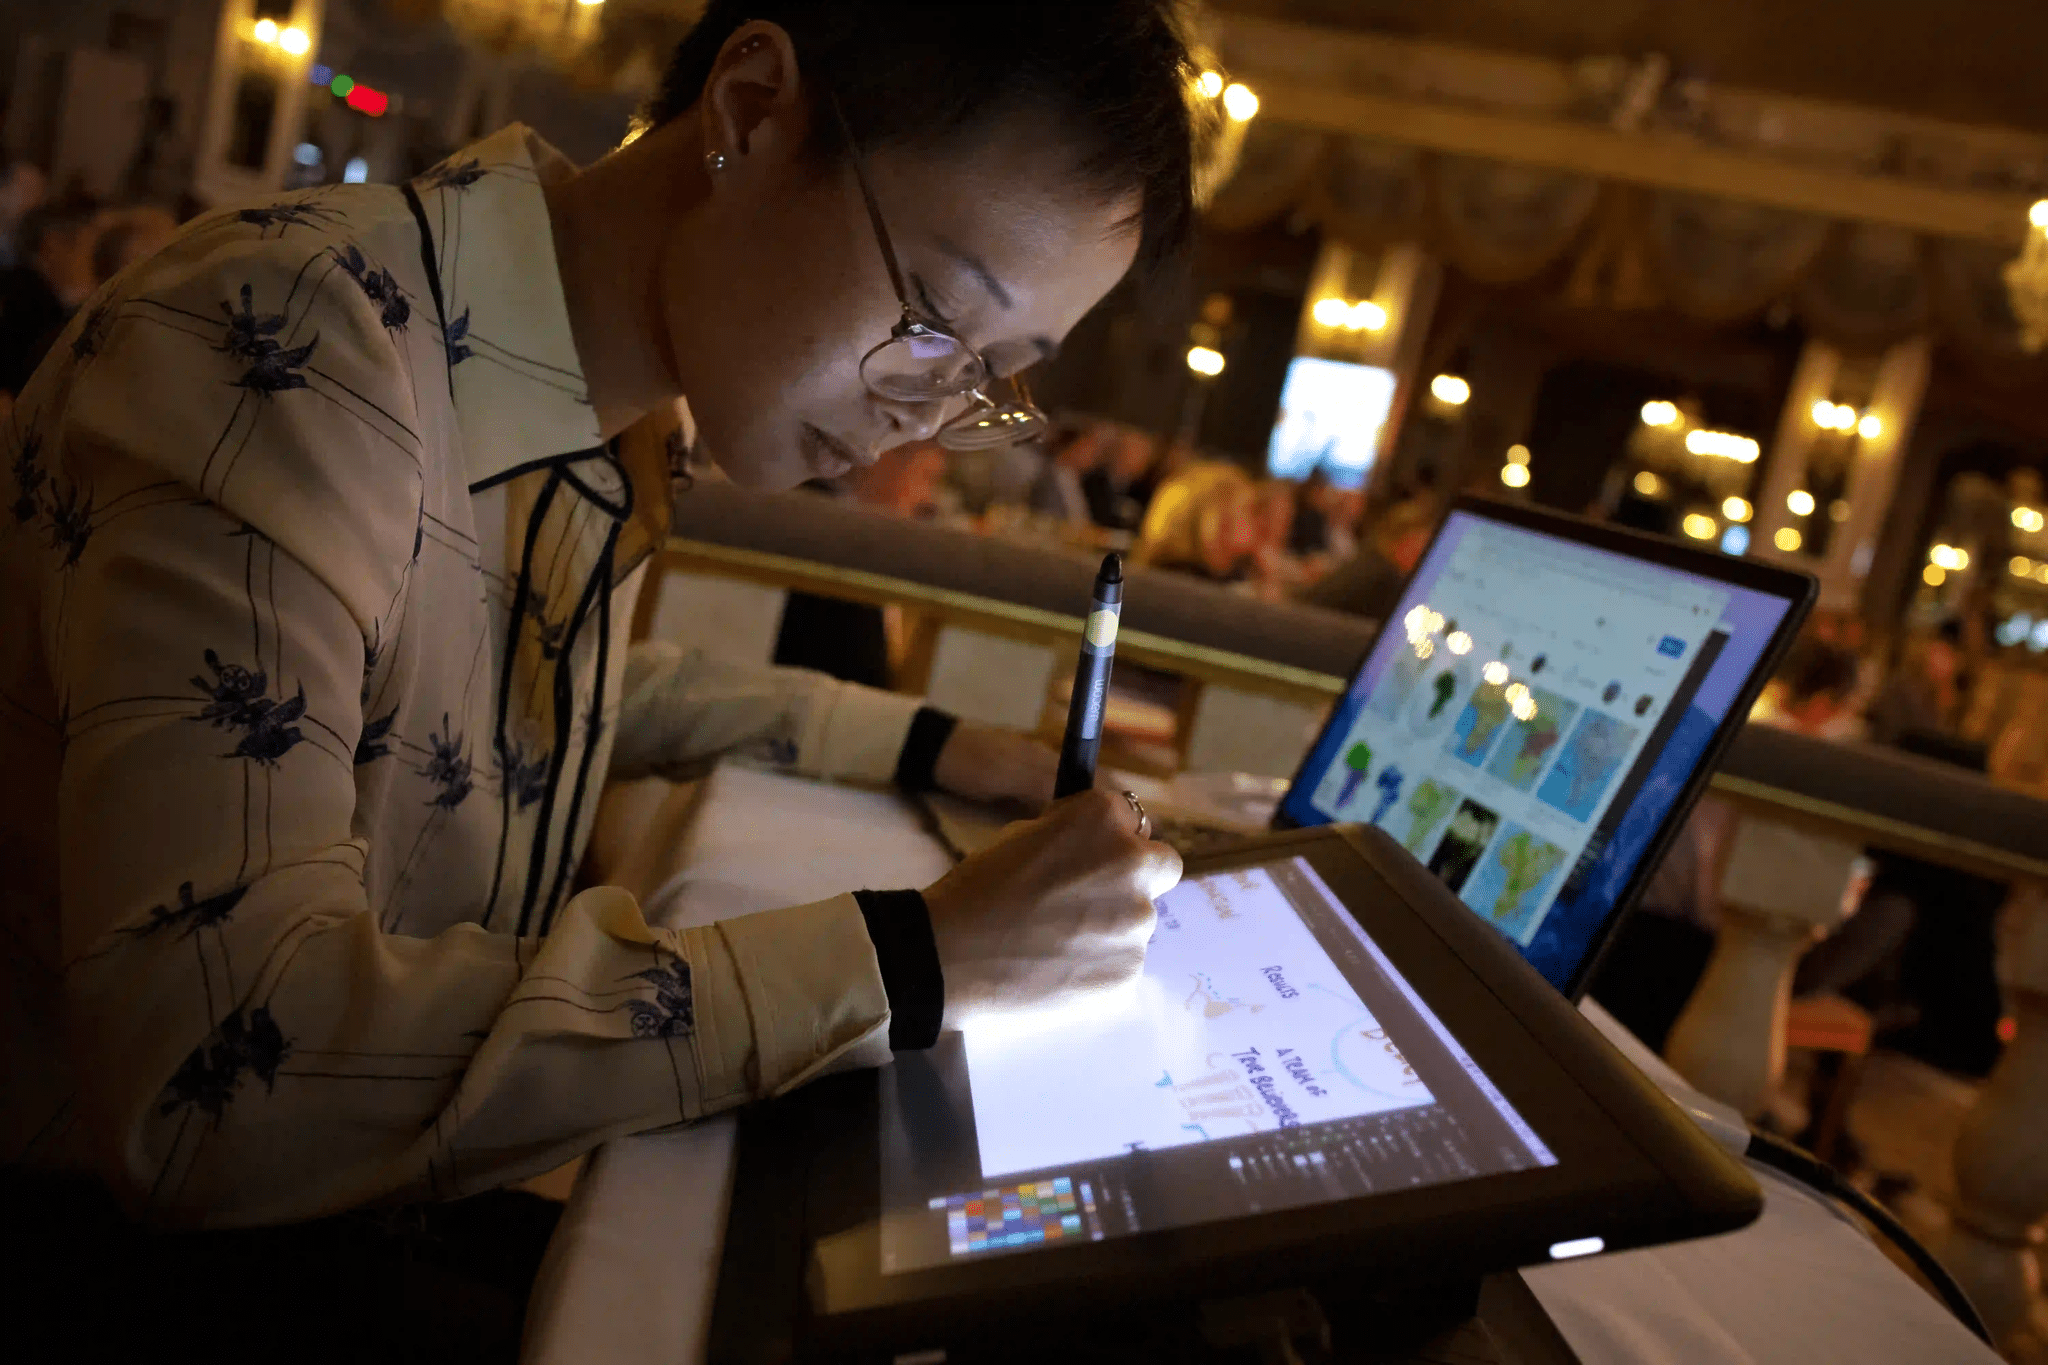
Graphic recorders capture ideas on a digital whiteboard or iPad in real time. For planned visuals, rough sketches establish hierarchy and flow before committing to detail.
Step 3: Refinement and Cleanup
Raw capture becomes polished visual communication here—lines tightened, typography standardized, hierarchy sharpened. Dense reactive notes become clear, decision-ready synthesis. This is the before/after moment in the illustration workflow.
Step 4: Exporting and Delivering Files
Export multiple formats: JPG or PNG for sharing, PDF for print, and always retain the layered source file for future edits.
Live Digital Visualization vs. Post-Event Visualization
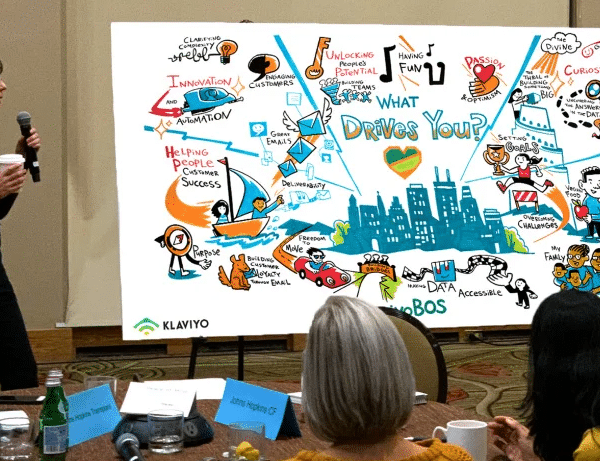
Live digital visualization delivers real-time alignment—powerful for remote teams on a digital whiteboard watching ideas form as they’re spoken. Post-event visualization offers deeper synthesis for broad distribution. Many teams use both: live capture for momentum, then a post-event pass that creates a reusable artifact.
Best Practices for Digital Visualization Projects
• Design for the decision, not the transcript—capture meaning, not every word.
• Know your delivery format before opening the canvas.
• Keep layers until final sign-off; export screen-ready, print-ready, and a master file.
Common Mistakes in Digital Visualization
• Starting at too low a resolution for the intended print size.
• Flattening layers too early and losing the ability to revise.
• Exporting only one file type, or misreading vector vs. raster for the job.
• Trying to capture every word instead of the meaning.
How Digital Visualization Supports Facilitation and Strategy
Digital visualization gives the group a shared map of what’s happening and makes themes, tradeoffs, and decisions visible. Paired with skilled visual facilitation, teams see what they’re agreeing to—and what still needs an owner. Leaders leave with a visual they can share, return to, and build on.
Storing and Reusing Digital Visual Assets
A layered digital file is an asset you can reuse and update for years. At ImageThink, we deliver high-resolution digital editions of all graphic recordings—so the visual keeps working long after the event ends.
Digital Visualization Turns Ideas into Shared Understanding
The tools have evolved. The power of visual thinking has not. Whether your team is in the room or across the globe, a well-crafted digital visualization aligns, energizes, and moves people forward.